
Revisiting Race Coefficients in Clinical Equations
Steph’s Note: We’re pharmacists (or pharmacists-to-be), which means we are rigorously trained to be detail-oriented. It’s our job to scrutinize medications and labs to ensure that this patient’s potassium of 3.3 is appropriately replaced or to alert the team about that patient’s increase in serum creatinine from 0.4 to 0.8. This ability to see individual trees, including memorizing and following algorithms and executing accurate math, is often what makes us integral members of the health care team. BUT let’s have a moment of honesty - our training to check out the trees sometimes means we miss the forest. So today, we’re taking a step back to see the bigger picture and ensure we recognize and fully understand the pros and cons of our daily assessments.
Helping us through this subject is Devki Gajera. Devki received both her PharmD and MPH (Master’s in Public Health) from Virginia Commonwealth University prior to completing a PGY1 Community-Based Pharmacy Residency at the University of Virginia in Charlottesville. She currently works as an ambulatory clinic pharmacist and is here to bring her melded pharmacy and public health perspectives to give us some serious food for thought about health equity.
Take it away, Devki!
Think back to the first time you learned how to measure kidney function, an organ that is arguably as vital as the heart, liver, and lungs. You probably have the Cockcroft-Gault equation permanently engraved in your mind after calculating the creatinine clearance (CrCl) for patient cases countless times. However, you may also occasionally find yourself going to an online calculator to determine a patient’s glomerular filtration rate (GFR).
As a refresher, the most commonly used kidney function estimators are summarized in this table:

If you were like most of us during pharmacy school, including myself, you may not have questioned the history and development of such clinical algorithms, especially the coefficients derived by statisticians, which are largely dependent on the intricate details of the population studied! The truth is that most equations don’t include disclaimers about the folks included in the studies. Why?

One meeellion citations!! Well. almost. (Image)
At some point, widely supported equations that are enveloped into clinical guidelines become part of the distant past and may rarely be revisited.
We trust consensus guidelines because we trust that clinical experts critically evaluated the referenced landmark studies.
It’s safe to say that it’s impossible to keep updated on all of the new research. Consider that almost 1 million citations were added to MEDLINE during 2020 alone.
So looking at those equations in the table above again, take a moment to ask yourself (if you haven’t before)… why does race factor in as a multiplier? Why was it included in these GFR algorithms, and how did they derive those VERY specific numbers??
It wasn’t until I participated in a residency topic discussion led by a nephrology clinic-based pharmacist that I dove into this question headfirst. During the summer of 2020, the entire world plunged into critical conversations about race...including the medical world. From a bird’s eye view, most of us broadly understand what race is, but it is more difficult to grapple with its role in the medical sphere. The history is complex, so disclaimer, I’ll only scrape the surface here in an attempt to briefly review this history.
What is Race?
Medical care and research evolved in tandem with the definition of race. Let’s take a look at a couple different perspectives of how to define this…
First, we can consider race as a scientific construct. What began initially as categorizing people based on physical characteristics alone (i.e., skin color) transformed into using science to justify racism. Directly linking race with genetics left a profound impact in our imagining of its validity in clinical care. A couple of examples…
The Age of Enlightenment in the 1680s was an intellectual movement to understand the natural world through art, philosophy, and politics. Ultimately, it led to many renowned philosophers, scientists, and researchers using science to associate race with level of intelligence, humanity, and power. Dr. Samuel Morton, a renowned physician and the president of the Academy of Natural Sciences, explored polygeny, which included securing skull samples from all over the world and looking at the differences between races. He connected race to intelligence, which was eventually used as an argument during the Dred Scott Supreme Court case to denounce Mr. Dred Scott’s intelligence and humanity. The argument used was that Mr. Dred Scott’s race automatically/genetically made him unable to comprehend that slavery benefited him as a slave. (FYI, Dr. Morton’s work has long since been denounced due to the many associations he made without true scientific creed!)
During World War II, the Nazi regime used eugenic science to justify anti-Semitic policies. Eugenics is the practice of selectively mating people with desirable hereditary traits to breed out disease, disabilities, and “undesirable” characteristics from the population. As a direct result, UNESCO (United Nations Educational, Scientific, and Cultural Organization) published its Statement on Race in the 1950s. It made four major points:
Mental capacities of all races are similar.
No evidence exists for biological deterioration as a result of hybridization.
There is no correlation between national or religious groups and any particular race.
It would be better to drop the term “race” and speak instead of ethnic groups.
So that’s the (supposedly) scientific perspective on defining race. Let’s look at another point of view.
Next, we can consider race as a socio-political construct that’s been historically forged through the oppression of certain groups of people. It’s been used to build social hierarchies through a systems-, policy-, and science-based approach.
And then there’s our current understanding of race as a social construct. Several studies have shown that genetic differences that exist within racial groups are actually greater than genetic differences between racial groups.
In 1972, Lewontin authored “Apportionment of Human Diversity” assessing racial differences. He found that differences within races were greater than differences between races. For instance, an African man in Nigeria had more in common genetically with a white man in Scotland than he did with an African man in Tanzania.
The Human Genome Project, completed in 2003, showed that individuals are more similar than they are different across all demographics. It sequenced the entire human genome with the hope of understanding the health needs of people based on their individual genetic make-ups. We shifted the use of genetic differences from a population-level to an individualized, targeted therapy mindset (think pharmacogenomics).
Although we may think racism is eradicated from science and health care, there are inequities that persist due to the effects of these historical policies and studies. When we talk about race, contextualizing its history and interplay with science is important in re-imagining its use for the future. Think about how patients in studies were racially categorized. Did patients or researchers choose their race? How many individuals from different races were included? How were multi-racial individuals classified?
Now that we’ve hopefully gotten your brain gears going and you may be looking at those equations in that first table with a more critical eye, let’s take those thoughts a few steps further.
What’s the Dilemma with Race and GFR?
You may be wondering why we have so many algorithms to measure kidney function, yet all of these equations incorporate serum creatinine. The gold standard for measuring kidney function is inulin, but we rely on serum creatinine as a surrogate because it’s a waste product from the normal wear and tear of muscles. Thus, everyone produces it and excretes it through their blood, albeit in varying levels.

Alternative biomarkers such as cystatin C are generally more expensive and time-intensive to measure compared to serum creatinine ($18.52 vs. $5.12 per 2020 Medicare costs, respectively).
While not used as commonly as CrCl for drug dosing, GFR (as calculated by the CKD-EPI equation) is, importantly, used to classify chronic kidney disease (CKD) as depicted in the image. This diagnosis impacts 37 million adults in the United States alone. African Americans are 3 times more likely to have CKD than White Americans, and Hispanic Americans are 1.5 times more likely to have CKD than non-Hispanic White Americans.
FYI, there are several medications that are dosed based on GFR rather than CrCl, and the table below is not comprehensive.

Sample medications dosed based on GFR rather than CrCl (not all inclusive).
As pharmacists, we focus on medications, but our recommendations should always be based on the patient’s full scope of health. The table below highlights just some of the many clinical uses of GFR:

Hopefully, all of this discussion about uses of GFR - from CKD detection and staging to medication management - has impressed upon you just how pervasive these algorithms are in our clinical care of patients. Now, it’s time to ask yourself again… how did race get into these equations, and now understanding that the definition of race itself has evolved with time, how exactly was race defined in the studies that got us to where we are today?
You may be thinking to yourself: maybe we include a race coefficient in the GFR equation because of statistical significance? Pause and repeat after me: statistical significance DOES NOT equal clinical significance. In previous studies, it was demonstrated that African Americans have higher average serum creatinine levels, which was theorized to be due to muscle mass, diet, and intrinsic kidney function...but this is still only loosely correlated.
So we’re still not quite getting to the answers we should need in order to appropriately understand and use our kidney function algorithms!
Let’s hone into the CKD-EPI equation, which was developed in 2009. It is more widely used today because, unlike the MDRD equation, it’s study included patients with and WITHOUT CKD. It is statistically more accurate in individuals with more normal kidney function. However, the CKD-EPI study modeled 1,728 Black individuals among a population of N=8254. For you math folks, that’s a mere 31% of the population. The authors then validated the algorithm in 3896 individuals, with 384 being Black. That’s a measly 10% (!!!) of the validation population. Ultimately, for any patient that is Black, their GFR is systematically 16% higher than a non-Black person, even if they are otherwise EXACTLY the same.
Bit disconcerting, right?
If you go back to the table of GFR’s many uses, you can theorize the potential impacts on clinical care. These could even include delayed referral to nephrologists, which is associated with decreased survival after CKD diagnosis.
This is an especially profound disservice to multi-racial individuals. I’d like to illustrate it for you through a bi-racial female (inspired by this TED Talk) who is asked to self-identify her race for registration - she cannot select more than one.
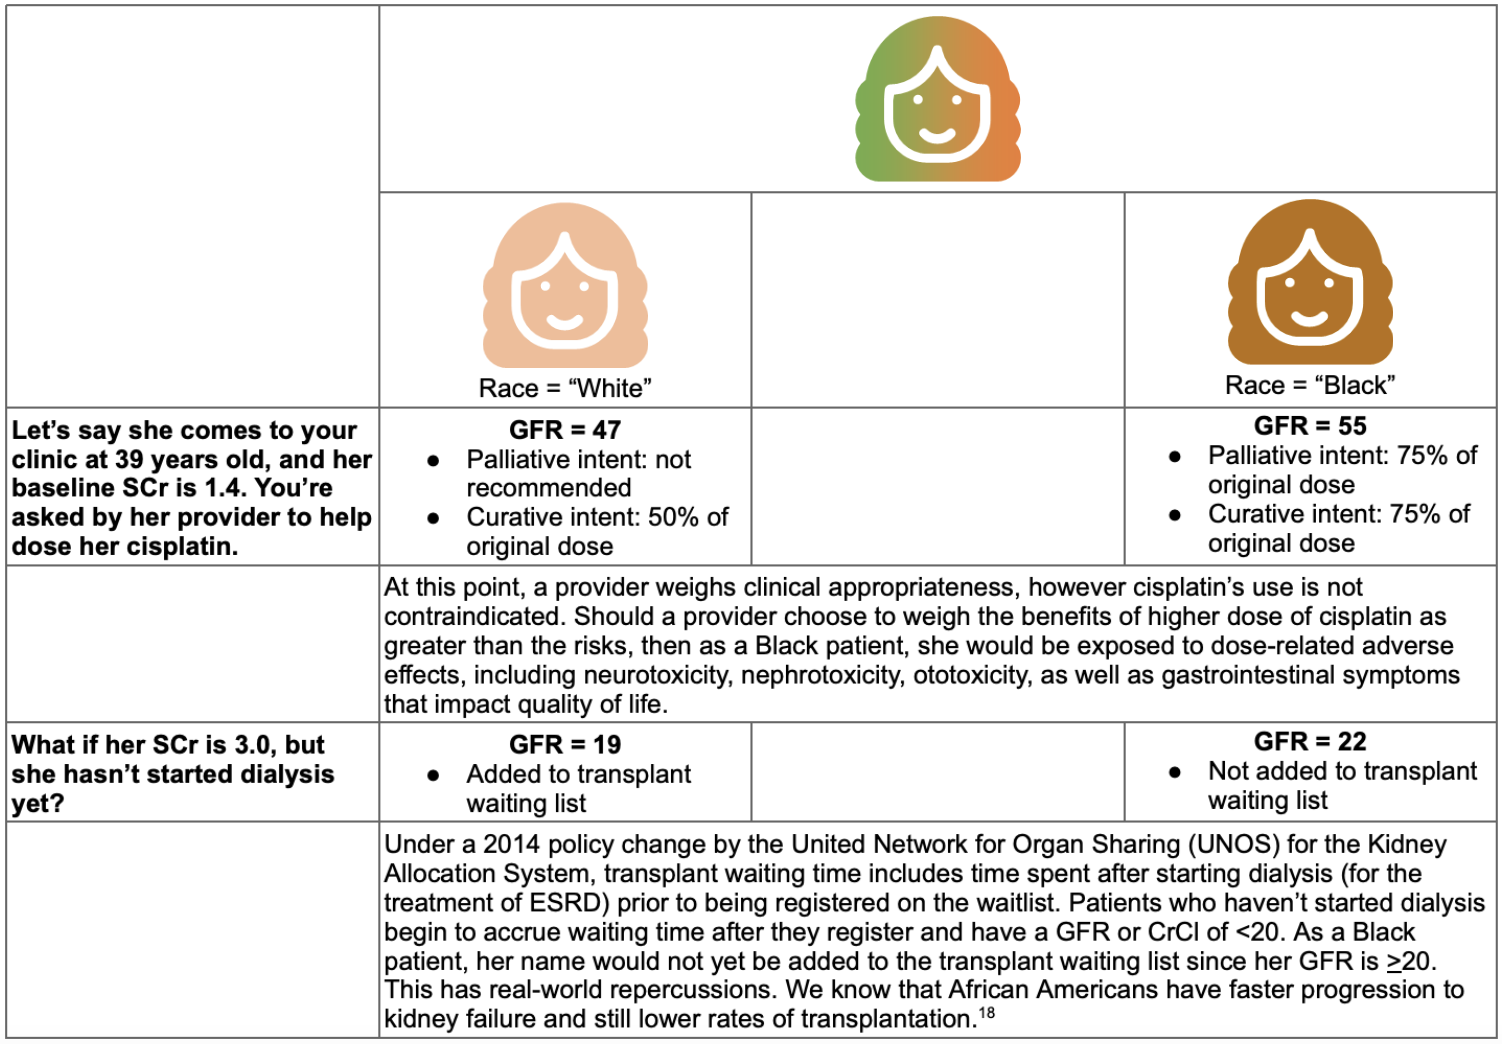
Staggering. ASTOUNDING. Terrifying, if you stop to consider the possibilities, especially when it’s not just kidney function algorithms we’re talking about here.
If you think that the GFR equation is alone in using a race coefficient, think again. Some other algorithms include:
Vaginal Birth After C-Section (VBAC) score which estimates the risk for a successful vaginal birth after a Cesarean section. For anyone identified as African American or Hispanic, the likelihood of a successful vaginal delivery is systematically lower, which could predispose these women to surgical procedures. C-sections carry the risk of postoperative infections and longer recovery time.
Fracture Risk Assessment (FRAX) score estimates the 10-year probability of a hip or major osteoporotic fracture. This risk is calculated as lower for Black individuals, which may delay preventative therapies such as bisphosphonates. Fractures are directly related to fall risk and mortality.
Get With The Guidelines Heart Failure (GWTG-HF) score estimates inpatient all-cause mortality risk for any patient that presents with a heart failure exacerbation. All Black patients are categorized as being at lower mortality risk which shouldn’t, but could, prioritize others’ care before their own.

(Image)
I don’t need to illustrate how these many algorithms can have a “domino effect” on our patient’s care throughout her life as a result of selecting her race to be either Black or White. Even for patients who aren’t necessarily multi-racial, are we appropriately applying even a single race to clinical algorithms and decisions?
So What Do We Do with Race Moving Forward in Health Care?
As I alluded to in the beginning, the conversation about race, racism, and health equity is more necessary than ever. The researchers who developed MDRD and CKD-EPI, most notably Andrew Levey, are revisiting their models. In August 2020, the National Kidney Foundation (NKF) and American Society of Nephrology (ASN) formed a Task Force on Reassessing the Inclusion of Race in Diagnosing Kidney Disease. The final report, submitted August 2021, is currently being reviewed.
Isn’t it powerful to see research pioneers in the nephrology world critically analyze their own work? This self-awareness has to occur in clinicians as well - you, me, and all of your pharmacist friends. The work has already started at some institutions.
For example, the University of Washington has transitioned to calculating GFR without adjusting for race after a joint conversation between medical students, Departments of Family Medicine and Laboratory Medicine, and Division of Nephrology. I expect this type of change may occur on a more widespread basis once the NKF-ASN Task Force releases its final recommendations, which could be any number of possible approaches listed in the table below.

In the meantime, what can you do? How can you advocate for health equity?

Risk factors versus risk markers… there IS an important difference! (Image)
Justify and explain why race is included as a variable. Does race relieve or exacerbate health inequities? Is race being used as a proxy for genetic variation? Are there known genetic markers that would explain specific racial differences?
Outline how subjects are racially categorized in the methods. Do subjects self-identify race? How are multiracial individuals identified?
Discuss all relevant factors in the discussion. These can include environmental exposures, age, and biologically plausible predictors other than race. If you are statistically powered to do so, include them in your analysis.
Prioritize the inclusion of diverse populations, especially those who are disproportionately burdened by the disease. Should the study’s results benefit a population that was not included?
Evaluate literature from a health equity perspective. Do the inclusion and exclusion criteria systematically reduce diversity?
Interpret risk factors vs. risk markers appropriately. Risk factors are statistically correlated and either cause an outcome or introduce subjects to the cause. A risk marker is an exposure that is correlated but not associated with the causal chain (see the image to the right). Basically, ask yourself - are statistically significant associations biologically plausible and clinically significant?
Identify when race is used as a proxy measure for a factor that just can’t be defined right now. And strive to work through a race-conscious rather than race-based medicine perspective. What’s the difference?

Advocate for patients when they fall into scientific “gray areas.” Use confirmatory tests if they are accessible and cost-effective. For GFR, this could be an alternative filtration marker like cystatin C instead of serum creatinine.
The tl;dr of Using Race in Clinical Care Algorithms
Whew, this was a lot of information, but honestly this isn’t even all of it! Most of us do not have the luxury of researching all of the clinical equations we use in our everyday patient care. BUT I’d challenge you to pause and reflect the next time you read a journal. Ask yourself one of the questions listed above.
I promise, just as the Cockcroft-Gault formula becomes muscle memory, this process also gets easier. Conversations with other providers become more insightful. Most importantly, your patients will receive the care they need and deserve.