
Heart Failure Part 2: Signs and Symptoms
This article has been reviewed and is up-to-date as of 08/12/2024.
Brandon’s Note: J. Nile Barnes, PharmD, BCPS is a Clinical Assistant Professor of Health Outcomes and Pharmacy Practice at the University of Texas at Austin College of Pharmacy. He's also a clinical pharmacist for an academic medical center. Prior to becoming a pharmacist, he spent several years as a paramedic.
Basically, he's got hands on experience with most levels of medical practice and education. And he's kind enough to share that experience with us all.
The following is Part 2 of an (excellent) 3 part series on heart failure. Last time we covered background and pathophysiology. In this post, we’ll cover signs and symptoms before moving on to pharmacotherapy in part 3.
As an FYI, you can get all 3 posts in this series as one downloadable (and printer-friendly!) PDF. PDF currently under construction as this series is being updated!
In our last post, we talked about the hemodynamics of heart failure (HF). We talked about right and left HF as well as systolic and diastolic HF (now called HFrEF and HFpEF, respectively). Now, let’s talk about the signs and symptoms of HF.
We’ll start with right HF.
Signs and Symptoms of Right-Sided Heart Failure
A great example of why a patient would have right-sided HF would be a right ventricular infarct (RVI). An RVI is basically a heart attack affecting the right ventricle (RV). It weakens the RV and compromises its ability to push blood forward.
The result is that blood backs up in the systemic venous circulation. So, we're left with increased pressure and volume in the venous side of our circulatory system.
The venous system is known as the capacitance side of the system. About 60% of your blood volume at any given time is on the venous side. The non-muscular veins and venules in the venous system are very elastic and will dilate with pressure, and their capacity (and pressure) will go up.
As the pressure in the RV increases, it backs up into the right atrium (RA) and then into the superior and inferior vena cavae. The superior vena cava then backs up into the common jugular, which backs up into the external jugular vein.
You can actually see and palpate the external jugular vein. That increased pressure will distend vessels and can be seen represented as dilated jugular veins, or JVD (jugular venous distention). In fact, you can measure the increase in pressure by sitting the patient at 45 degrees and measuring the height of the dilation. Many years ago, this was the only way to estimate the venous pressure.
Increased pressure in the inferior vena cava causes a back up into the systemic circulation and can cause the liver to become engorged with blood, even to the point of extending the lower margin of the liver downward enough that it can be palpated below the 12th rib.
Mind you, the patient must be thinner than I am to feel that liver edge. Sometimes the liver can actually hurt. The fibrous capsule surrounding the liver can be stretched, causing some upper right quadrant pain. It can also be responsible for a hepato-juglar reflex. Pushing gently on the liver can engorge the jugular vein and increase the JVP (jugular venous pressure).
The pressure in the rest of the systemic circulation can cause peripheral dependent edema, especially if the patient has a low albumin level. Serum (the liquid portion of the blood) leaks out of blood vessels all the time, but it usually leaks back in also. This is the principle behind oncotic pressure. The pressure in the vessels is now greater that it was before, and some of the fluid stays in the interstitial space. This is seen as edema. The more edema, the greater the pressure.
I said it was peripheral dependent edema. The “dependent” part means that it is the part of the body that is hanging down. In other words, the feet, ankles, and lower legs for most patients. In bedridden patients, it can also appear as edema in the lower back in front of the sacrum (often called pre-sacral edema).
Of course, this edema can cause other vascular (venous) engorgement. Abdominal edema in the form of organ edema can form, as can ascites (although ascites with HF is usually associated with concomitant hepatic cirrhosis).
BTW, for a random clinical pearl, edema of the GI tract can decrease absorption of some drugs.
Signs and Symptoms of Left-Sided Heart Failure
Now, onto the left side. If the left ventricle (LV) loses its ability to pump forward, the blood will back up in the left atrium (LA) and then through the pulmonary veins into the lungs. This is the only place it can go.
The result is pulmonary edema. Since most of us sit upright, it pools in the dependent areas (i.e. both lower lung fields). This usually manifests as bilateral basilar crackles or rales (some folks shorten this to bibasilar rales).
Of course, this extra fluid in the lungs is not just pooling in the alveoli. It is first in the interstitial spaces which interferes with oxygen-carbon dioxide exchange and may cause hypoxia.
The patient may feel dyspneic, often described as having shortness of breath (SOB).
As a side note, patients don’t understand what you mean when they read their charts and see SOB… They think you’re calling them a “son of a bitch”, so I would not use that abbreviation.
The very worst pulmonary edema results in the patient coughing up pink-tinged, foamy sputum. When the fluid back up is severe enough, it brings some red blood cells (RBCs) along with the serum and mixes with the pulmonary surfactant. These patients are usually VERY sick and may die.
Other Signs and Symptoms of Heart Failure
That extra pressure in the heart (on the right or left) will cause the release of the hormone BNP, now called B-type natriuretic peptide (formerly called brain natriuretic peptide).
BNP stimulates the kidneys to lose sodium in the urine (natriuresis) which is followed by water (diuresis). We take advantage of this by using BNP levels as a biomarker for HF.
BNP levels > 100 pg/mL almost always mean excess pressure in the heart, and the likely culprit is HF. Low values (< 100 pg/mL) make the diagnosis of HF less likely, although it is still possible. The 2022 American Heart Association/American College of Cardiology/Heart Failure Society of America (AHA/ACC/HFSA) Guideline for the Management of HF cite a BNP of ≥ 35 pg/mL as the suggested threshold for evidence of structural heart disease and increased filling pressures.
Vital signs will also change. Typically, at first, the respiratory rate (RR), heart rate (HR), and blood pressure (BP) may go up as adrenergic stimulation tries to overcome the hypoxia. As the process continues (and fails), you will often see the RR drop and subsequently the HR and BP may plummet.
If you were measuring the saturation of oxygen in the hemoglobin (SaO2) by pulse oximetry, you would find it will drop also. Below 90% is officially bad juju for anyone.
You have, no doubt, seen something like the figure below: the Frank-Starling mechanism. Let’s now explain it in terms we have been talking about.
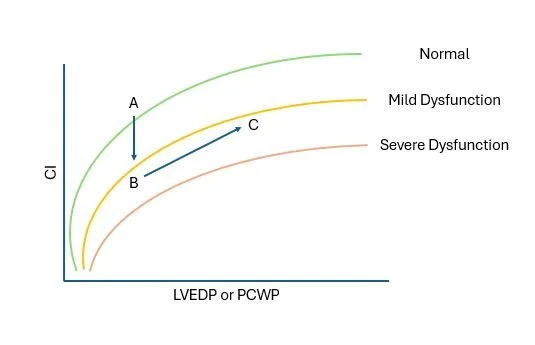
On the x-axis, the left ventricular end diastolic pressure (LVEDP) or pulmonary capillary wedge pressure (PCWP) is plotted. On the y-axis, the cardiac index (CI) is plotted.
The figure is then divided into four quadrants. The LVEDP represents the pressure in the LV at the end of diastole, when it should be the lowest. The PCWP is an estimate of this, because it is really hard to measure pressures in the LV.
PCWPs are not easy to obtain either, but markedly easier than the LVEDP. A normal PCWP is 4 - 12 mmHg.
Cardiac Output (CO) varies by the size of the patient, so we use the CI as a way to normalize CO values. This allows us to make meaningful comparisons between patients. It's very similar to how we use the INR as a measurement of PT when monitoring warfarin.
Remember that stroke volume (SV) times heart rate (HR) equals cardiac output (CO).
SV x HR = CO
We divide this by the body surface area (BSA) of the patient to get the CI. Now we've got a useful measurement which can be compared between patients.
Normal CI values are 2.5 - 4 L/min/m2.
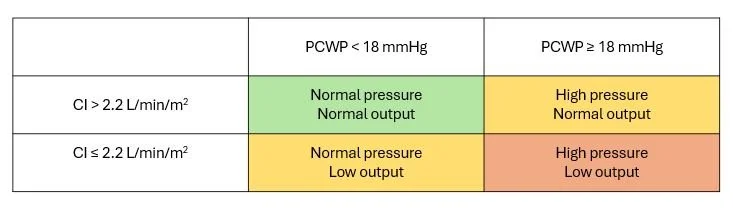
Low values for CI suggest low CO states, and high values mean high CO states. Likewise, low values for PCWP indicate low pressure states, and high values mean high pressure states.
This table describes the four possibilities. Note that the normal values don’t appear in the table. This is because there is some variation between individuals, and just because a value is outside of the “normal” does not mean it is pathologic.
If we overlay this table over the figure above, we get something like this:
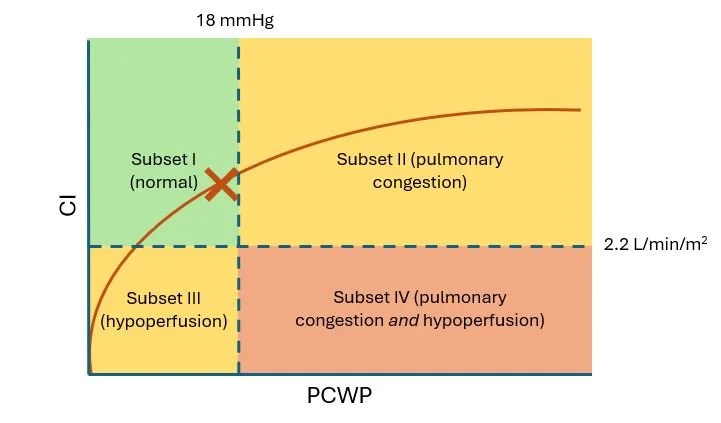
Fluid volume is an important part of HF. If 'X' marks the current PCWP and CI of a normal patient, over-hydrating the patient (by giving them too much IV fluid, for example) pushes the X along the line into subset II and will cause pulmonary congestion (edema).
Similarly, too much of a diuretic will move the X into the subset III territory and will cause hypovolemia, resulting in hypoperfusion and hypotension.
Decreased forward flow (as seen in HF) will depress CO and can lower the CI below the usual 2.2 L/min/m2, resulting in hypoperfusion again.
Combine that with fluid overload, and you can end up in subset IV: pulmonary congestion and hypoperfusion.
Many of the therapies for HF are attempting to push the Frank-Starling curve upward. We'll talk about these in our next post.
So, here’s a question for you: Where does the heart muscle get its blood supply? Answer: The coronary arteries. They are the FIRST vessels that come off of the aorta. That is, the heart feeds itself first (pretty greedy if you ask me).
So, the heart also feels the drop in CO and that makes it less effective (less oxygen delivery, therefore fewer adenosine triphosphate (ATP) molecules can be made, and less work can be done). This, of course, makes HF worse. That’s right, HF can make HF worse! *insert death spiral image here*
That decreased forward flow from the LV causes other problems. The most important of these is usually renal insufficiency. This can be either acute kidney injury (AKI) occurring right after an event (like a myocardial infarction (MI)), or could be chronic kidney disease (CKD) from chronic low CO. Both are caused by decreased renal perfusion.
Poor perfusion of other organs (the liver, in particular) can also occur, leading to dysfunction.
BTW, the fluid overload can be particularly troublesome in terms of pulmonary function. Pulmonary edema can impair oxygen-carbon dioxide exchange. This can make the patient hypoxic, and leads to respiratory acidosis (retained CO2). The retained CO2 can also lead to hypercarbic respiratory failure.
Let’s go back to something I mentioned earlier—vital signs. As the heart decreases output (either systolic or diastolic in origin), the baroreceptors in the carotid bodies will notice a decrease in pressure. This will stimulate a neuronal response from the brain to the adrenal glands. This leads to an increase in catecholamine (epinephrine, norepinephrine) release which in turn makes the heart work harder.
The decreased pressure will also signal the renin-angiotensin-aldosterone system (RAAS) to release more renin and aldosterone. The renin cuts angiotensinogen up, leaving angiotensin I. Angiotensin converting enzyme (ACE) converts angiotensin I to angiotensin II.
The angiotensin II, aldosterone, and catecholamines are involved in cardiac remodeling. Increasing the problem further, aldosterone causes sodium and water retention, leading to fluid overload.
When I remodeled my house, it was a home IMPROVEMENT project. Cardiac remodeling is NOT an improvement; it makes things worse.
So, to recap, the major signs and symptoms of HF are:
Edema
Fluid overload
Renal insufficiency
Hepatic dysfunction
Electrolyte disturbances (hyponatremia, leading the way)
Vital sign changes
Stay tuned for Episode III: Return of the JEDI Mechanisms, where we will discuss the drug targets more.
Get this Series as a PDF!
Want a printer-friendly version of the ENTIRE heart failure series? Or do you just want to save the series for offline viewing? You can now get the entire Heart Failure Series as a single (and attractive) PDF. PDF currently under construction as this series is being updated!